
Key Takeaways
- Attribution analysis is not just performance measurement; it decomposes a portfolio's excess return into specific modeled effects, primarily allocation, selection, and interaction, to explain how performance differed from a benchmark.
- For advisory firms, it is helpful to distinguish between historical performance attribution, a broad industry discipline, and comparative portfolio analysis, which is more closely aligned with what platforms like VRGL support in prospect and client conversations.
- The choice between holdings-based and returns-based attribution often depends on data availability, a key consideration when analyzing a prospect's held-away assets from statements.
- Benchmark selection shapes attribution quality; an inappropriate benchmark can produce attribution results that are technically correct but may not reflect the decisions an advisor actually made.
- Factor-based attribution complements traditional sector attribution by providing a different lens on performance, explaining returns through exposure to systematic risk factors like value or momentum.
- Much of the practical value of attribution analysis for an advisory firm comes from translating its mathematical output into a clear, objective client conversation, supported by a shared analytical and presentation baseline.
Many advisory firms can produce some form of attribution analysis. Consistently translating those outputs into a conversation a client finds clear, objective, and useful is often harder. This gap highlights a core tension in modern wealth management: the analytical methods for decomposing portfolio performance are well established, yet the distance between a raw attribution report and a client-ready explanation remains wide at many firms. Workflow is an important contributor to that gap, alongside the analytical work itself.
Attribution analysis is a quantitative method used to explain a portfolio's performance relative to a benchmark by decomposing its returns into specific, explainable components. By contrast, comparative portfolio analysis focuses on evaluating a current portfolio against alternatives or proposed changes across dimensions such as risk, diversification, fees, and other portfolio characteristics. The goal is to identify which active management effects contributed to or detracted from performance relative to the chosen benchmark, not to prove manager intent.
This article examines the methodologies and practical considerations of using attribution analysis in a wealth management context. We will cover what it measures, the core components of the Brinson-Hood-Beebower model, key distinctions between different attribution approaches, and how benchmark selection shapes the results. Most importantly, we will explore the operational challenge of structuring attribution outputs for effective client communication, the point where analytical work becomes advisory value, while distinguishing those broader industry methods from the comparative portfolio analysis workflows VRGL supports.
What Attribution Analysis Measures and Why It Matters for Advisory Firms
Attribution analysis moves beyond simple performance measurement. While performance reporting tells you how much a portfolio gained or lost over a period, attribution analysis explains the sources of that gain or loss relative to a benchmark. It provides the analytical basis for answering a question many clients eventually ask: "Why did my portfolio do what it did?" In this article, that historical performance attribution framework is distinct from comparative portfolio analysis, which focuses on evaluating an existing portfolio against alternative allocations, models, or proposals and is more closely aligned with what VRGL supports.
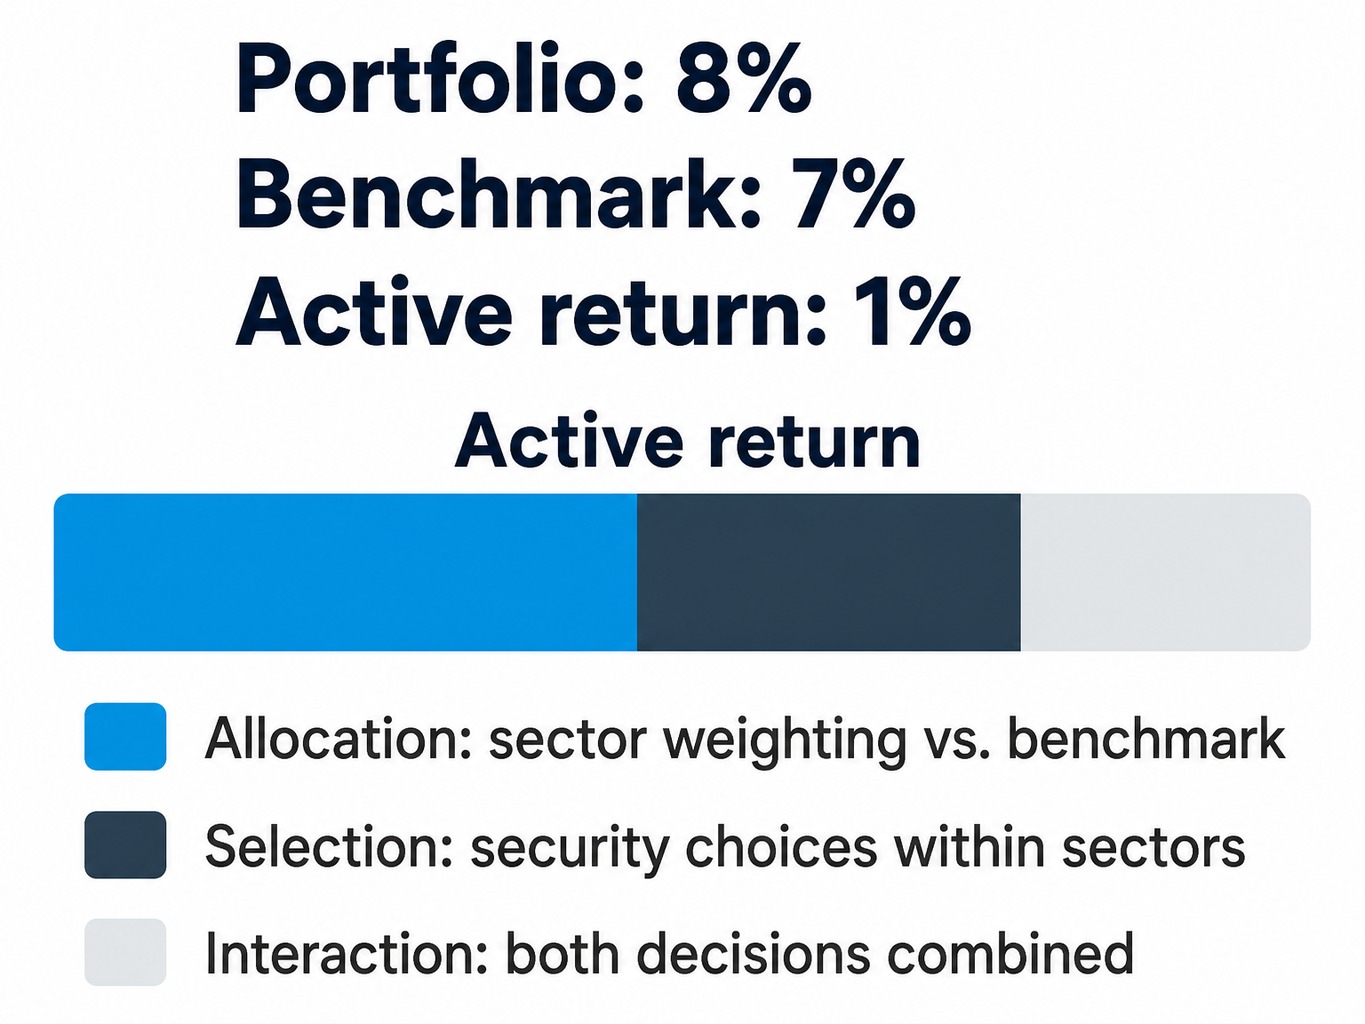
The foundational model for most equity performance attribution is the Brinson-Hood-Beebower (BHB) framework . This approach separates a portfolio's active return, the portion of the return that differs from the benchmark, into distinct effects. The most common decomposition includes three primary components:
- Allocation Effect: The impact of overweighting or underweighting specific sectors or asset classes relative to the benchmark.
- Selection Effect: The impact of choosing securities within those sectors or asset classes that perform differently than the benchmark's holdings.
- Interaction Effect: The combined impact of allocation and selection decisions.
Consider this illustrative example: a portfolio returns 8% in a period where its benchmark returns 7%. The 1% excess return is the active return. Attribution analysis decomposes that 1% into modeled effects to show how much came from, for instance, overweighting the technology sector relative to the benchmark, how much came from picking specific tech stocks that performed better than the benchmark's tech holdings, and how much came from the combined effect of those two positions.
For advisory firms, attribution analysis serves as a structured framework for accountability and communication. It can help firms explain benchmark-relative performance and discuss how a model attributes results across allocation, selection, and interaction effects. At the same time, attribution does not by itself establish a manager's intent or prove why particular decisions were made. It describes the return effects associated with positions relative to a benchmark. In practice, that is different from comparative portfolio analysis, where the goal is often to evaluate an existing portfolio's characteristics and communicate potential alternatives in a prospect or client conversation.
Allocation Effect, Selection Effect, and Interaction Effect
Clients and sometimes internal team members can conflate the different effects in an attribution analysis, particularly allocation and selection. This confusion can undermine the very clarity the analysis is meant to provide. Understanding the distinct contribution of each component can help firms produce outputs that communicate effectively.
How Allocation and Selection Effects Differ
The allocation and selection effects isolate two different types of benchmark-relative effects.
The allocation effect measures the return impact of weighting sectors or asset classes differently from the benchmark. It isolates the top-down positioning effect of where the portfolio differed from the benchmark. If a portfolio manager overweights the technology sector relative to the benchmark, and the technology sector subsequently performs better than other sectors, the allocation effect will be positive. This effect decomposes performance into a modeled benchmark-relative contribution. It does not, on its own, prove why the manager chose that position.
The selection effect (or security selection) measures the return impact of choosing specific securities within a sector that perform better or worse than the benchmark's securities in that same sector. It isolates the bottom-up effect of what the portfolio held within each allocation. For example, even if a portfolio is benchmark-neutral on the technology sector, it can generate a positive selection effect if the specific tech stocks it holds perform better than the collection of tech stocks in the benchmark index.
This distinction can help clarify where performance came from in the model. An attribution report that separates the two effects can show that even if a broad asset class underperformed, the specific securities chosen within it may have added value, or vice versa.
What the Interaction Effect Represents
The interaction effect is often the component that practitioners find most difficult to explain, and some implementations combine it with other effects. It represents the combined, simultaneous impact of allocation and selection decisions. Specifically, it captures the cross-product of sector overweights or underweights and security overperformance or underperformance. For instance, the interaction effect measures the added return from overweighting a sector and also holding outperforming stocks within that same overweighted sector.
Both Brinson-Hood-Beebower and Brinson-Fachler can be expressed using allocation, selection, and interaction effects. If you see an attribution report with only two effects, that presentation usually reflects a particular implementation choice about how to combine or redistribute interaction, rather than a distinction unique to Brinson-Fachler. Understanding this helps reconcile reports from different systems and explains why an interaction term may appear in some analyses but not others.
Holdings-Based vs. Returns-Based Attribution
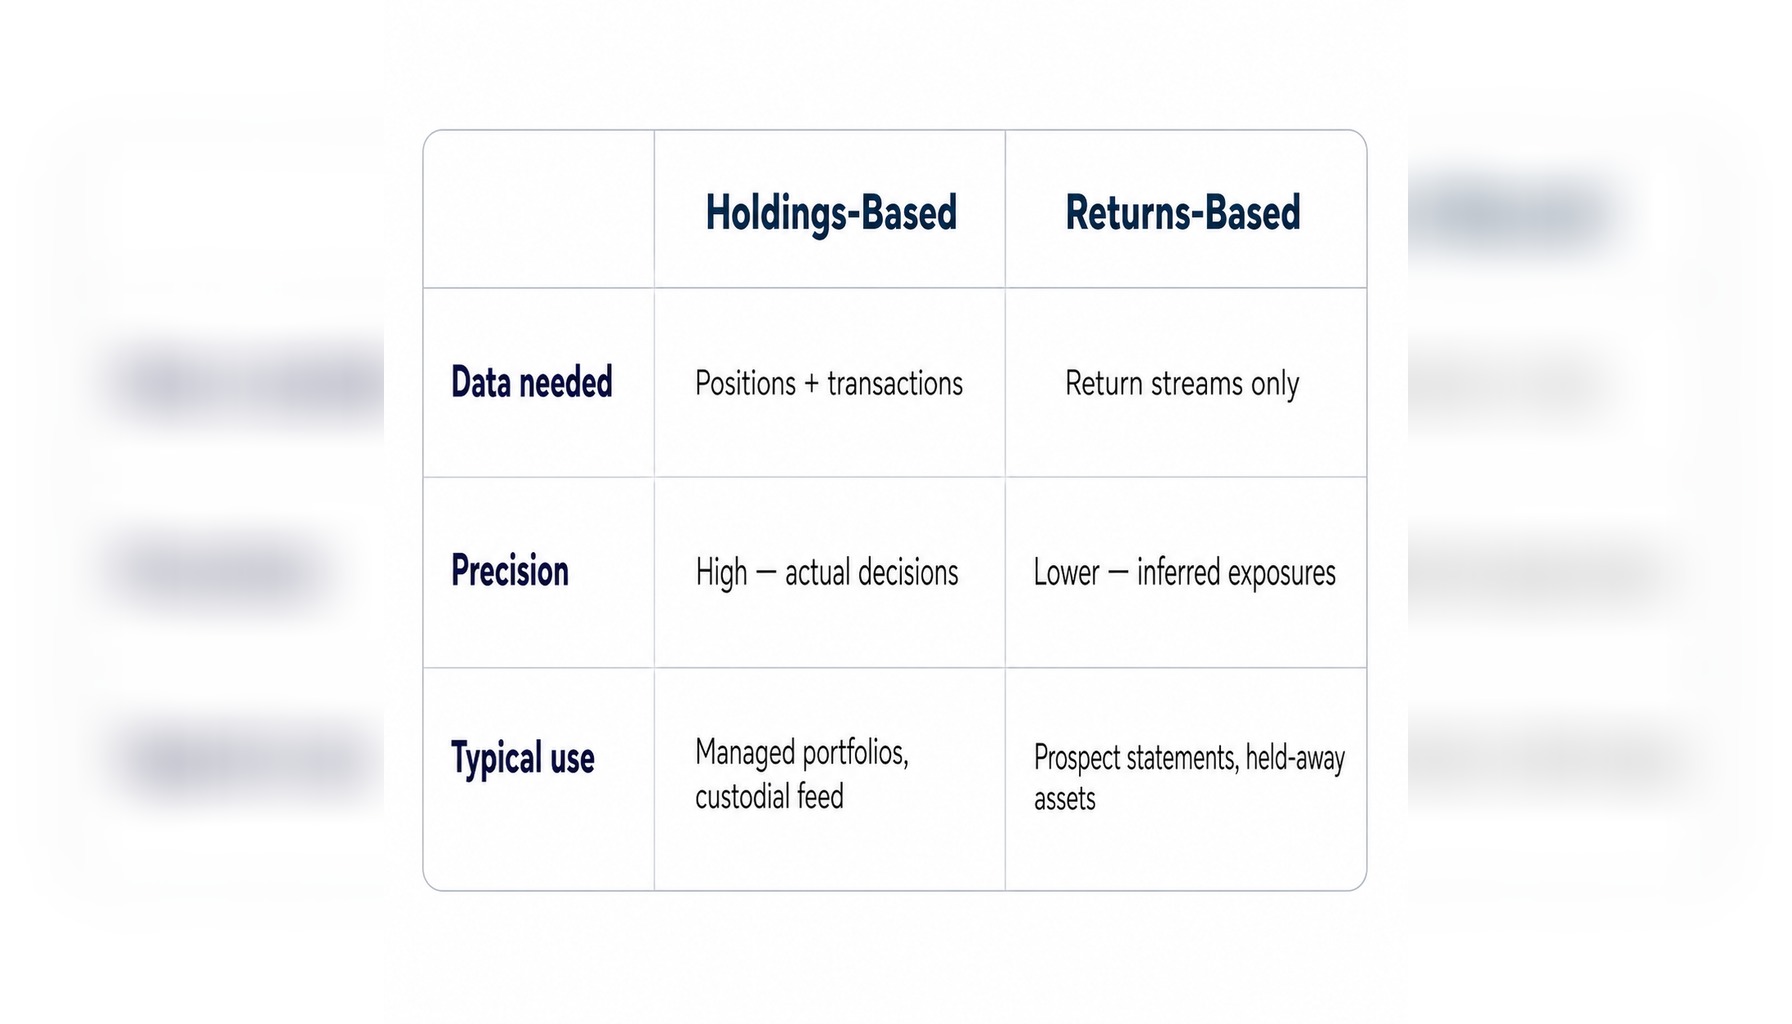
Advisory firms frequently need to run attribution on portfolios where they do not have complete, daily holdings data. This is a common scenario when analyzing a prospect's existing portfolio from a statement or evaluating held-away assets consolidated from multiple custodians. This data constraint introduces an important methodological choice.
Holdings-based attribution is the more traditional approach. It uses a portfolio's actual positions at specific points in time and security-level returns to calculate allocation and selection effects, and some implementations also incorporate transaction data to improve precision around cash flows and rebalancing. This method can be granular and precise, but the quality of the result depends on the completeness and timing of the holdings data available.
Returns-based attribution , by contrast, works without complete position-level data. It uses series of portfolio and benchmark returns, along with the returns of various market factors or style indexes. Through statistical methods like regression, often referred to as Sharpe-style return decomposition, it infers the portfolio's exposures to different styles, such as large-cap growth or small-cap value, and attributes performance to those inferred exposures. In practice, this approach generally requires a sufficiently long series of returns to be meaningful, so a single quarterly statement is usually not enough for robust statistical attribution.
This distinction has practical implications for advisory firms. When analyzing a portfolio the firm manages with a direct custodial feed, holdings-based attribution is often preferred for its precision. However, when an advisor is in a prospect meeting reviewing a portfolio held at another institution, the available information may be limited to periodic statements or partial holdings snapshots. In those situations, a firm may be able to perform only a more limited holdings-based review, or it may need additional return history before a returns-based style analysis becomes meaningful. Analytics tools that support flexible data intake can help firms move from raw statement data to a structured comparison more consistently.
How Factor-Based Attribution Complements Sector Attribution
Traditional Brinson-style attribution decomposes performance by sector or asset class, answering whether allocation and security selection decisions added value within that defined structure. In recent years, factor-based attribution has become a more common complement, offering a different and often deeper perspective.
Instead of using sectors as the analytical lens, factor-based attribution decomposes returns by a portfolio's exposure to systematic risk factors. These factors are quantifiable characteristics often cited as drivers of returns, such as:
- Value: Exposure to stocks that are inexpensive relative to their fundamentals.
- Momentum: Exposure to stocks with strong recent performance.
- Size: Exposure to smaller-capitalization companies.
- Quality: Exposure to companies with stable earnings and strong balance sheets.
- Volatility: Exposure to stocks with lower-than-average price volatility.
These are not competing methods but complementary ones. Sector attribution explains performance through the structure of the portfolio, while factor attribution explains it through the underlying risk characteristics of its holdings.
A portfolio's sector attribution might, for example, show a strong positive selection effect in the technology sector. The advisor might conclude their tech stock picks were superior. However, a factor-based analysis might reveal that the outperformance came primarily from a strong portfolio-wide tilt toward momentum stocks, which happened to be concentrated in the tech sector during that period. The factor lens surfaces a systematic exposure that sector-level analysis can obscure.
For advisory firms, incorporating factor analysis can lead to more sophisticated conversations about risk and return drivers. However, it is more data-intensive, and many firms use formal risk model frameworks such as Barra or Axioma for this work, while others use simpler statistical approaches depending on the question being asked and the data available. The decision to use it often depends on the firm's investment philosophy and the depth of analysis its clients expect.
Why Benchmark Selection Shapes Attribution Quality
The meaningfulness of attribution analysis depends heavily on the benchmark it measures against. Yet benchmark selection often receives limited treatment in how advisory firms produce and present attribution. Every effect, allocation, selection, and interaction, is calculated relative to the benchmark's weights, holdings, and returns. If the benchmark does not reasonably represent the portfolio's intended strategy or the client's expectations, the attribution results can be technically correct but may not reflect the decisions actually made.
The choice of benchmark effectively frames the performance narrative, functioning as an active input to the analysis rather than a neutral background variable. The same set of investment decisions can show a positive allocation effect against one benchmark and a negative effect against another.
For example, consider two appropriate but differently weighted multi-asset benchmarks for the same balanced portfolio, one at 60% global equities and 40% fixed income, and another at 50% global equities and 50% fixed income. If the portfolio carries a modest equity overweight, the allocation effect may look favorable against the more conservative benchmark but less favorable, or even negative, against the more equity-heavy benchmark. The direction of that allocation effect depends on how equities and fixed income perform relative to each other over the measurement period, not simply on whether the portfolio is overweight equities. In that case, the attribution difference comes from benchmark construction rather than from a change in the portfolio itself.
While common benchmarks like the S &P 500, Russell 3000, or MSCI ACWI are standard for equity performance attribution, multi-asset portfolios often require blended or custom benchmarks to be meaningful. The CFA Institute's GIPS standards include considerations around benchmark appropriateness and disclosure, and firms may want to evaluate how those principles apply to their client reporting to ensure the analysis is both fair and clear.
From Attribution Output to Client Conversation
Many advisory firms have the technical capability to produce attribution analysis. A significant challenge lies in the workflow that translates those outputs into a clear and consistent client conversation. Alongside the analytical work, that gap has important operational and communicative dimensions.
Attribution outputs from institutional analytics platforms often arrive as dense tables of sector weights, return contributions, and residuals. These tables are typically designed for analytical completeness rather than client presentation. As a result, they usually need interpretation and reformatting before they can be used effectively in a client review or prospect presentation.
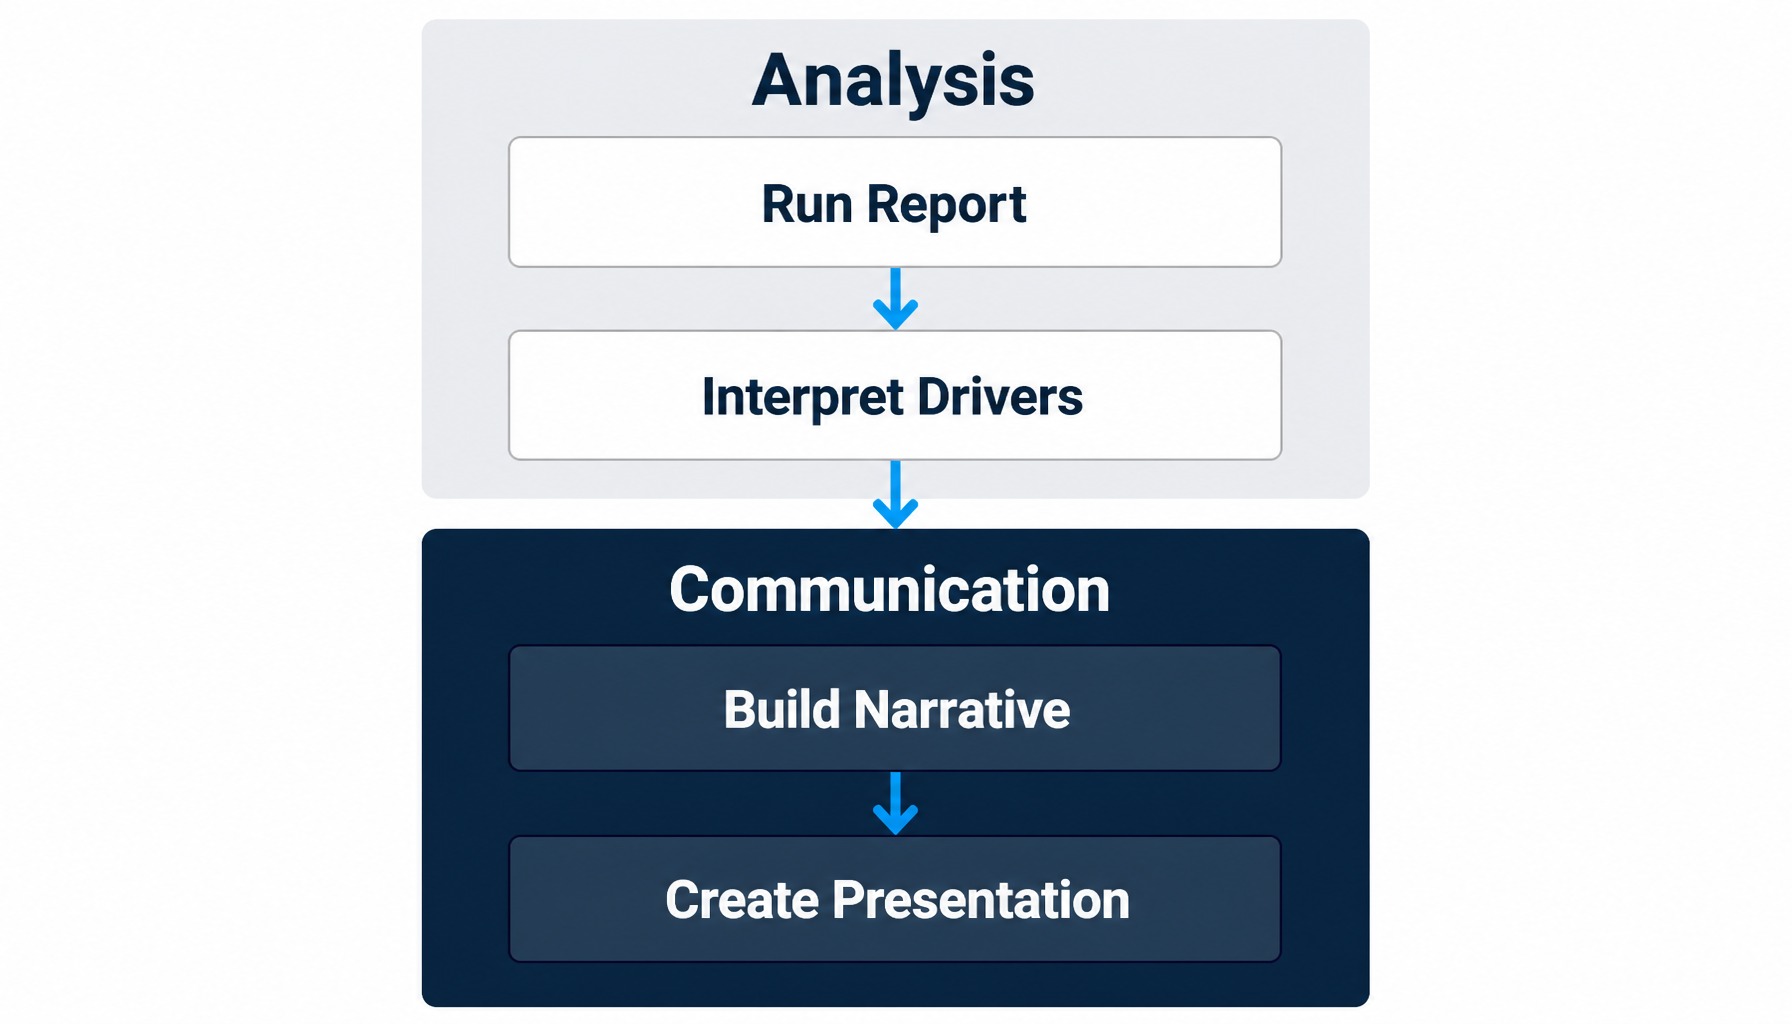
Turning these tables into client-ready material typically involves several steps, whether the audience is an existing client in a quarterly review or a prospect evaluating a new firm. For each portfolio, an advisor or support team member may need to:
- Run or request the attribution report from a portfolio analytics system.
- Interpret the raw data, identifying the key drivers of performance.
- Translate the numerical output into a clear narrative that connects to the client's goals and the firm's investment philosophy.
- Manually create slides or report pages to present these findings, ensuring the firm's branding and disclosures are applied correctly.
When this process is repeated across dozens of clients and multiple advisors, the preparation time compounds. The format and depth of the output can also vary from one advisor to the next, which can create governance challenges. A structured approach to the output can give teams a shared analytical and presentation baseline that supports a clear, objective conversation, alongside the rigor of the underlying calculations.
Read more: Three Proposal Tips for Advisors | VRGL
How VRGL Supports the Move from Portfolio Analysis to Client-Ready Presentations
VRGL is a growth platform for wealth management firms that supports the workflow of moving from portfolio data to client-ready presentation materials. In this context, it is important to distinguish broader industry attribution methodologies, such as Brinson and factor attribution, from the comparative portfolio analysis workflows VRGL supports.
Once an advisor has a client's or prospect's portfolio statements, VRGL's AI-powered statement extraction can help turn that source material into usable portfolio data. Advisors can then review five-pillar comparative portfolio analytics covering performance, risk, diversification, taxes, and fees, and carry those insights into branded, client-ready proposals and presentations through VRGL's proposal management capabilities .
This workflow can support advisors as they evaluate existing portfolios and communicate insights clearly, particularly in acquisition and review conversations. The platform does not perform Brinson attribution or factor attribution, and it does not make investment recommendations or replace professional judgment.
For multi-advisor firms, VRGL's templates are intended to help teams present portfolio insights in a more uniform format; disclosure content and its review remain the responsibility of each firm's compliance function.
Conclusion
Ultimately, the value of attribution analysis for an advisory firm depends on more than the sophistication of its mathematical models. The methodologies are well-documented and widely available. How the firm structures the output for client conversations is an important contributor to that value, alongside sound methodology and benchmark choices.
This article has moved from what attribution measures, through the methodological choices that shape its quality, such as the Brinson components, holdings-based versus returns-based approaches, factor versus sector analysis, and benchmark selection, to a practical reality: translating analytical output into client communication is a distinct step with its own challenges.
Where clients and prospects seek transparency into how their portfolios are managed, the connection between a firm's analytical depth and clear, objective communication becomes an important consideration.
This content is for informational purposes only and should not be considered investment, legal, tax, or compliance advice. VRGL does not provide any such advice; guidance on specific circumstances is best developed in collaboration with relevant professionals.
Frequently Asked Questions
Why does attribution analysis sometimes produce a residual?
Residuals in attribution analysis typically arise from factors not captured by the model, such as timing differences in cash flows, compounding effects in multi-period analysis, or currency fluctuations. Multi-period linking methods, such as the Carino or Menchero approaches, are designed to minimize these residuals by smoothing compounding effects over time, but they may not eliminate them entirely. A significant residual can also be a signal of data quality issues or a mismatch between the benchmark and the portfolio's actual investment style.
How does fixed income attribution differ from equity performance attribution?
Fixed income attribution is generally more complex because bond returns are driven by different factors. Instead of the sector allocation and security selection common in equity attribution, fixed income attribution decomposes returns into components specific to bond portfolios. These often include the impact of interest rate changes (duration and yield curve positioning), credit spread changes, security selection within specific credit qualities or maturities, and currency effects for non-local bonds.
Can attribution analysis be applied to multi-asset or balanced portfolios?
Yes, but it requires a multi-level attribution framework. The first level of analysis typically attributes performance to the firm's asset class allocation decisions (e.g., the choice to overweight equities versus fixed income). Subsequent levels then drill down to attribute performance within each asset class using the appropriate methodology; for example, using a sector-based model for the equity portion and a duration- and spread-based model for the fixed income portion. Benchmark construction is also more complex, often requiring a custom blended benchmark that reflects the portfolio's strategic asset allocation.
How do multi-period linking methods affect attribution accuracy?
While a single-period attribution (like for one month) is mathematically straightforward, linking these results across multiple periods is not. The effects of allocation and selection do not sum up perfectly over time due to the effect of compounding. Different linking methods exist to handle this. For instance, geometric attribution links returns by compounding them, which is intuitive but can leave a residual. Smoothing approaches instead distribute that residual across the individual effects so the final numbers sum to the total active return. The choice of linking method can materially change the magnitude of reported effects over longer horizons.
What GIPS considerations apply when reporting attribution analysis results?
The CFA Institute's Global Investment Performance Standards (GIPS) focus on ensuring the fair representation and full disclosure of investment performance. While the GIPS standards do not prescribe a specific attribution methodology, they do include requirements and recommendations related to composite construction, calculation methodologies, and benchmark disclosure. Firms that claim GIPS compliance and also report attribution results may want to evaluate how their benchmark selection, calculation methods, and presentation formats align with the standards' core principles of transparency and consistency. Firms may wish to consult their compliance teams or GIPS verifiers for specific guidance.